Data Preprocessing: Enhancing Data Quality and Analysis Accuracy

Real-world data is often incomplete: lacking attribute values, lacking certain attributes of interest, or containing only aggregate data, Noisy: containing errors or outliers. Inconsistent: containing discrepancies in codes or names. Data preprocessing is a technique that converts raw data into understandable data. It transforms the data into a format that can be easily and effectively processed in data mining, machine learning, and other tasks.
The primary steps involved in data preprocessing are:
- Importing the libraries:
import pandas as pd
import numpy as np
from sklearn.impute import SimpleImputer
We have to import the above libraries.
pandas: it is used for data analysis. It helps in analyzing, cleaning, exploring, and manipulating data.
numpy: it is a package used for computing in Python
sklearn.impute.SimpleImputer: it is used for replacing missing values
- Importing the dataset:
The dataset that would be used for data preprocessing is the Auto MPG dataset from the UCI website.
The dataset concerns city-cycle fuel consumption in miles per gallon (MPG) to be predicted in terms of 3 multivalued discrete and 5 continuous attributes.
columns = ["MPG", "Cylinders","Displacement","Horsepower","Weight","Acceleration","Model Year","Origin","Car Name"]
data_df = pd.read_csv('/content/auto-mpg.csv')
We first define the column names, as it is not given in the original dataset, and store them in a variable “columns”. To read the dataset, we use the pandas library.
- Define X and Y values:
X represents the input or independent variables of the dataset. It consists of the feature attributes and is used in predicting the target variables. Y represents the output or dependent variable(s). It consists of the target attributes.
X = data_df.drop(['MPG','Car Name'], axis = 1).values
y = data_df['MPG'].values
- Checking missing values:
To check whether the dataset contains missing values, we use isnull().sum(). This gives the total number of missing or ‘Nan’ values in each column.
data_df.isnull().sum()

As seen, both X and Y values contain missing values. To impute the missing values either mean, median, or the most frequent value is used according to the data type. For example, if the column is of numerical type then mean or median can be used. Since the Horsepower column is numeric, the missing values are replaced with the mean values of that column. MPG is the target variable and is advised not to be imputed unless you are sure of its value. This is because target variables control how the algorithm learns. Therefore, the best way to deal with the missing values is to delete them.
data_df['MPG']=data_df['MPG'].fillna(data_df['MPG'].mean())
data_df['Horsepower']=data_df['Horsepower'].fillna(data_df['Horsepower'].mean())
- Splitting the dataset into train and test values:
The dataset is split into train and test values. The purpose is to train the model using the train values and assess the model based on the test values.
from sklearn.model_selection import train_test_split
x_train, x_test, y_train, y_test= train_test_split(x_imputer, y_imputer, test_size= 0.2, random_state=0)
- Feature scaling:
Also known as data normalization, it is a method that is used to normalize the range of independent variables or feature data. It involves adjusting the values of the independent variable so that they have similar ranges and distributions. To perform feature scaling, we import the StandardScaler library from sklearn.preprocessing library.
from sklearn.preprocessing import StandardScaler
st_x= StandardScaler()
x_train= st_x.fit_transform(x_train)
x_test= st_x.transform(x_test)
- Fitting the model:
Using linear regression algorithm for fitting the model.
from sklearn.linear_model import LinearRegression
ml = LinearRegression()
ml.fit(x_train, y_train)
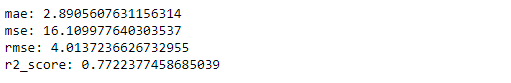
- Evaluating the model:
The model is evaluated using different metrics such as r2 score, mean absolute error, mean squared error, and root mean squared error.
from sklearn.metrics import mean_absolute_error, mean_squared_error
from sklearn.metrics import r2_score
y_pred = ml.predict(x_test)
mae = mean_absolute_error(y_test, y_pred)
mse = mean_squared_error(y_test, y_pred)
rmse = mean_squared_error(y_test, y_pred, squared=False)
r2 = r2_score(y_test, y_pred)
print(f'mae: {mae} \nmse: {mse} \nrmse: {rmse} \nr2_score: {r2}')
References:
https://deepnote.com/@a_mas/Data-Preprocessing-Tools-4943e322-768c-4961-b30f-c0e8f63bf0ec
https://www.kdnuggets.com/2019/07/data-pre-processing-optimizing-regression-model-performance.html
By Arushi Paliwal