End-to-End Engine Horsepower Prediction with Deep Learning Regression Part-I

Introduction
This is a series of 4 articles where we will explore how to build a horse power prediction model using Deep Learning Regression from scratch. We will cover data pre-processing, model building, model tracking and model deployment in this series of blogs.
In this blog we will cover data pre-processing.
Data Preprocessing:
Data preprocessing is a critical step in the data analysis and machine learning pipeline. It refers to the process of cleaning, transforming, and organizing raw data into a format suitable for further analysis or model training. The quality of the data
and the effectiveness of any machine learning algorithm heavily depend on the quality of the preprocessing. I have taken the fuel efficiency dataset which contains the following attributes 'MPG', 'Cylinders', 'Displacement', 'Horsepower', 'Weight', 'Acceleration', 'Model Year', 'Origin' of automobiles in late-1970s and early 1980s.
We can get the dataset from this link.
In the preprocessing we need to do the Data Cleaning, Data Transformation, Feature Selection, Handling Categorical Data, Data Reduction, Handling Outliers and etc.
- Importing the libraires:
For the preprocessing we need to import some libraries as shown in the code snippet mentioned below.
import matplotlib.pyplot as plt
import numpy as np
import tensorflow as tf
import pandas as pd
import seaborn as sns
- Loading the Dataset:
First download and import the dataset using pandas.
url = 'http://archive.ics.uci.edu/ml/machinelearning-
databases/auto-mpg/auto-mpg.data'
column_names = ['MPG', 'Cylinders', 'Displacement', 'Horsepower', 'Weight','Acceleration', 'Model Year','Origin']
dataset = pd.read_csv(url,
names=column_names,na_values='?', comment='\t',sep='
', skipinitialspace=True)
By using pandas we can load the dataset.
- Cleaning the Dataset:
The dataset contains a few unknown values.
By using some pandas functions we can clean the data.dataset.isna().sum()
Dropping the null values in the data.dataset = dataset.dropna()
Getting the number of rows and columns in the final dataset.dataset.shape - Data Visualization:
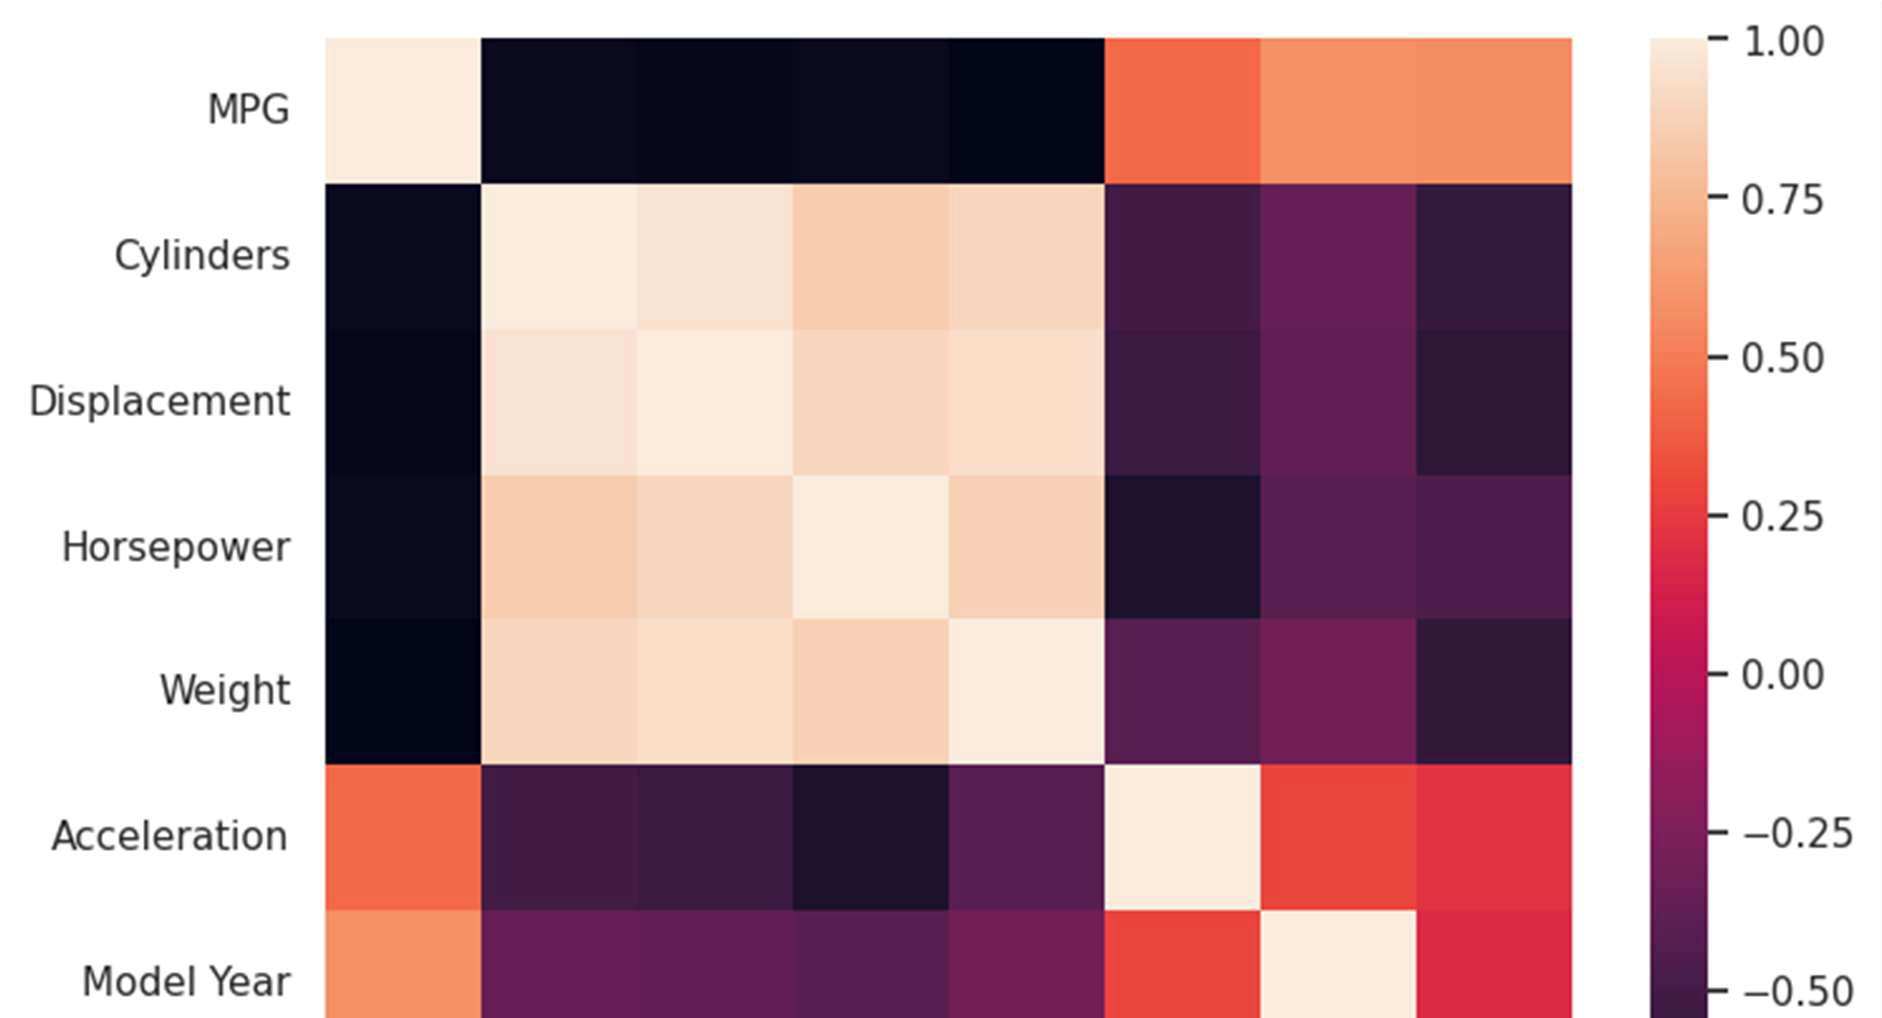
Next, let’s print a heatmap that shows the correlation between the numerical columns in the dataset.plt.rcParams["figure.figsize"] = [8, 6]
sns.heatmap(dataset.corr())
In the next article I will discuss Model Building.
References:
https://bpb-us-w2.wpmucdn.com/sites.umassd.edu/dist/9/1285/files/2022/10/8-merged.pdf
https://www.kaggle.com/code/khalidjeffal/linear-regression-for-predicting-mpg
By Rayapureddi Subhash