JavaScript Debugging
What is Debugging ?
Debugging is the process for finding bugs, errors or problems in the code which will not allow the code to work at its full functionality and solving them to resume the proper operations of the program. When a particular software/program does not work as expected, web developers study the program to find the problems and resolve them.
What is JavaScript Debugging ?
This is a process of finding errors, bugs and problems in the JavaScript code and fixing them.
There are various processes and methodologies which are present to solve and debug them.
Many developers use Develop tools present in Chrome to debug JavaScript.
Some scenarios where JavaScript Debugging is used:
- To identify syntax errors and solve them.
- Resolving logical errors, there are the errors where the code does not produce the expected results due to faulty algorithms and logic. Debugging allows developers where they can step through the code, inspect each of the variables and track the flow of the whole execution of the code in order to find errors and fix issues.
- In fixing Runtime Errors, these errors lead to crash or unexpected behavior of the code. Debugging helps in finding the source of the errors and it provides proper insight into how we can fix them.
- To inspect variables and values in the code through different phases of the code execution, it allows us to monitor the values of variables as different points in the code execution. This helps in the state of the program and in identifying and correcting incorrect or unexpected values.
How to open the Debugging Window and Access the Source code? (If your browser is Chrome)
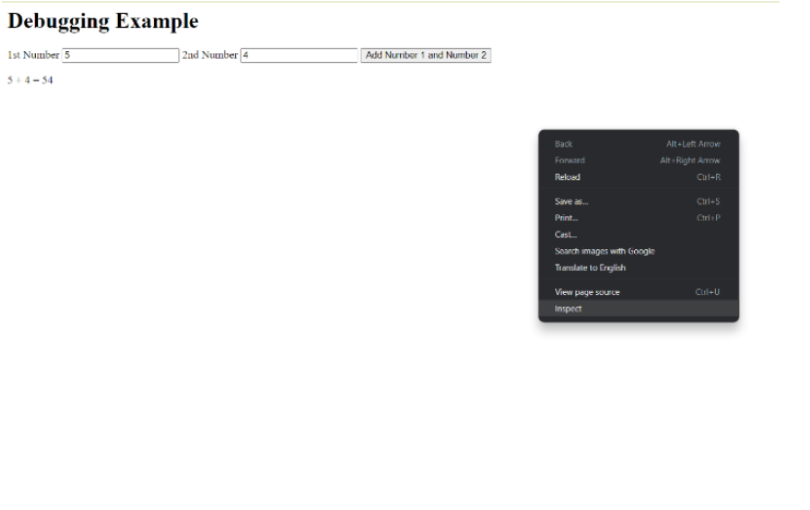
Step 1: Open your Chrome browser and right-click and open “Inspect” or “Inspect Element.”
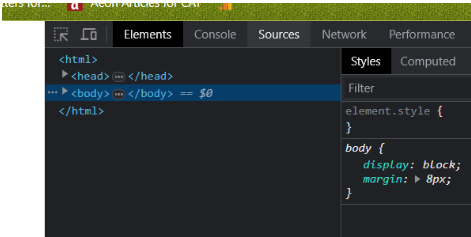
Step 2: Once you open the Console you can navigate through various options, select “Source.” Source is the location where you can find your source code and further use it for debugging.
To the right of the source code is called the Debugging pane or Debugging Window where several options are there to identify the bugs and errors in the code.
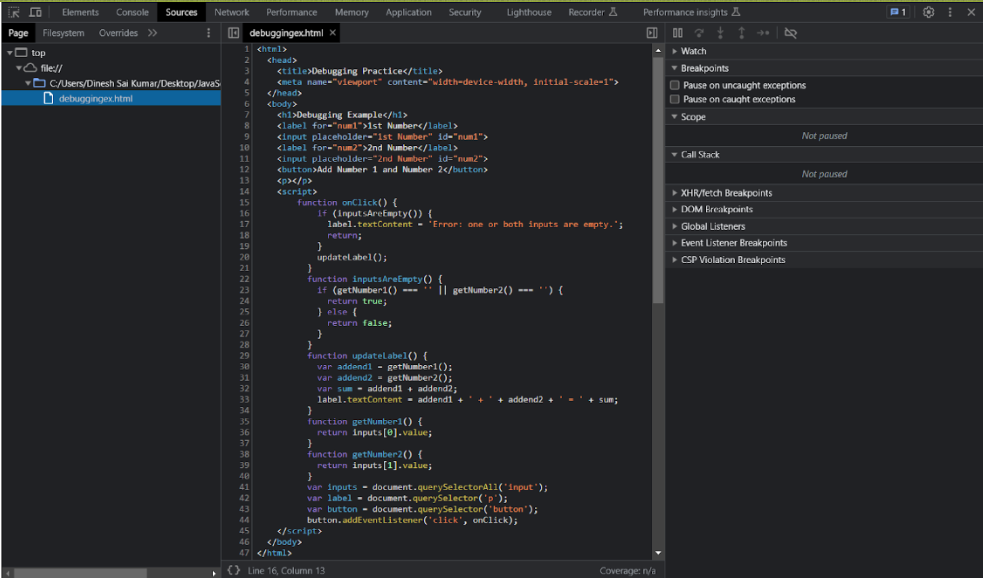
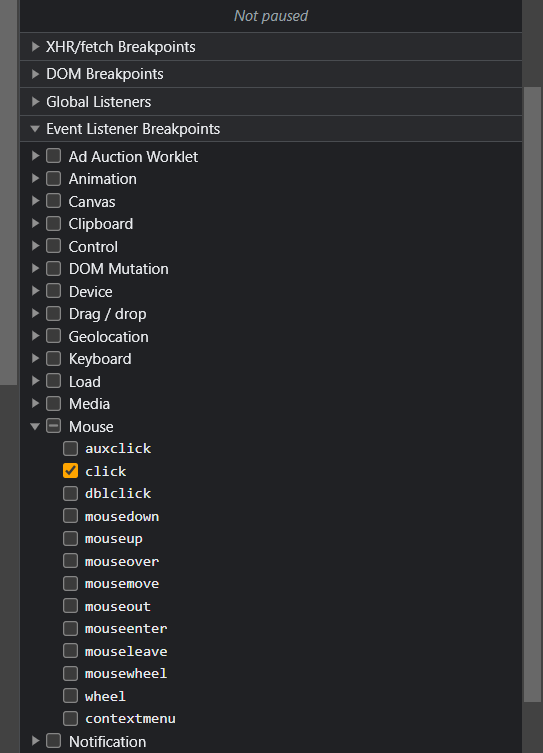
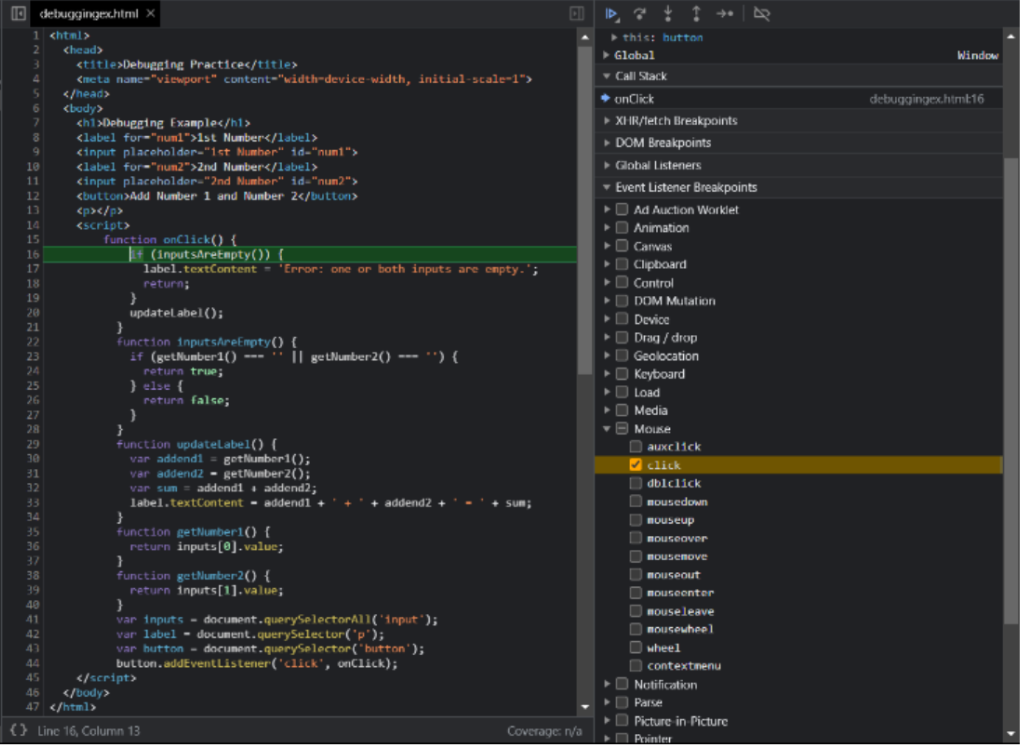
Step 4: Navigating through the debugging window, you can find various options but for the above code we will be using Event Listener Breakpoint, Scope and Watch, using these will be debugging the code and manipulating it to work perfectly.
In the Event Listener Window, open Mouse and choose on the options Click.
This means that every time a click is registered, the code halts and we can start debugging.
Now the code will be paused every time a click has been registered.
We can see the code has stopped near onClick() functions which registers the click.
Step 5: There are 5 mains buttons which we use for debugging and in navigating through the entire code.

- 1st is Resume Script Execution, which resumes the entire process when we encounter a breakpoint.
- 2nd is Step Over Next Function when clicked it steps over the Function. This is usually used if we are sure that a particular function is performing all the tasks which should be performed by it.
- 3rd is Step into next function, this is used to steadily check each and it moves into functions to check each line.
- 4th is Step out of current function; this is clicked to step out and come out of the current function they are in.
- 5th is Step this is used to navigate within the code line to line, it flows with the code and gives us proper insight of the code.
- 6th is Deactivate breakpoints; this is used to remove all the breakpoints that are set to a code. This is typically used when all the bugs are removed and when the breakpoints are to be removed.
Step 6: When the button is clicked, the code will stop at the onClick() function.
The green line indicates the breakpoint where the code will be stopped, and starting from that point onwards we should start debugging the code.
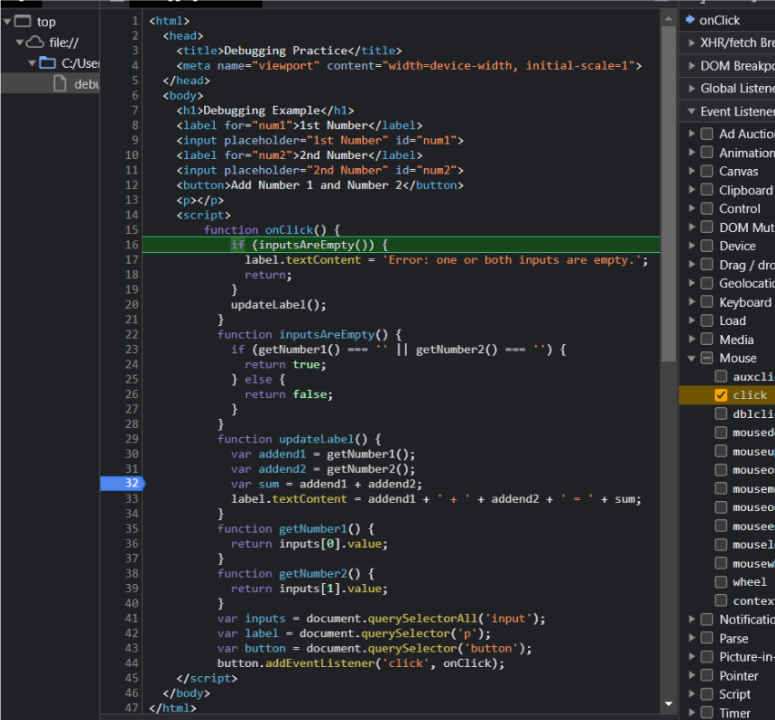
Click Step into Next Function, this navigates through the code shows at what points the state of the code is, we can see the variables of the code and each line if there are any in scope. After parsing through the code we can find the scope that the variable is found in
Double Quotes ( “ “ ) , this means that the variables have been considered as strings and the input values must be changed.
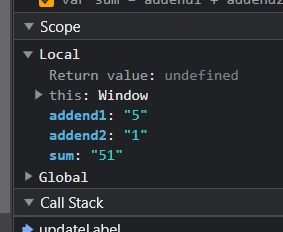
We can go to Watch and track the type and state of variables which are designed by the user. ( to check the type of sum, we can watch and search typeof sum, it will display the type).

Step 7: It is now evident that the input variable type is wrong and we should change. If I test it, changing the type of variables will give me a correct answer. I will go to “Console Window” and test it.

Yes, when we change the type of Input variables it is giving the desired output. So, we change the same source code and try running the code again after debugging.

Here we can see that we are getting correct output. Therefore, the debugging process is complete.
GitHub Repo Link to access the above code:
https://github.com/DineshSaiKumarPilla1/DebuggingNew-.git
Conclusion:
Debugging is a very helpful and handy process for developers to find bugs and solve them. It is evident that although there are many ways to debug a code, every developer who wants to thrive in the field should learn to use different and efficient ways to debug a code.
Learning how to debug is very handy and could be very efficient in solving problems. Chrome JavaScript Console is a one the most used debugging tool or panel to debug java scripts.
References:
- https://www.w3schools.com/
- https://www.krishnatraining.com/post.php?pid=1350&id=1&pt=14&gp=0#:~:text=Ans%3A,From%20Step%20%2F%20Run%20to%20Step.
- https://www.google.com/search?q=what+is+debugging&oq=what+is+debugging+&aqs=chrome..69i57.2440j0j7&sourceid=chrome&ie=UTF-8
Do Checkout :
To know more about such interesting topics, visit this link.
Do visit our website to know more about our product.
Article By, Dinesh Sai Kumar Pilla
Reviewed By, Meghana Prabhandham