PRICE ANALYSIS USING LSTM

LSTM stands for long short term network. It is a type of a recurrent neural network with higher power to remember the output of the previous node so that the accuracy for predicting the next outcomes increases. LSTM is the solution for the vanishing gradient or long term dependence issue in the RNN.
As LSTMs are capable of learning long-term connections between data time steps, they are primarily used to learn, process, and classify sequential data. Applications of LSTM include
∙ Sentiment Analysis
∙ Time Series Prediction
∙ Language Modeling
∙ Speech Recognition
∙ Video Analysis
And in this article we are going to study from initial to the final stage of time series prediction using of the LSTM on stock price dataset which changes with time. The stages in this include data preprocessing, data splitting, modeling, training, hyper parameter tuning and then deployment.
Figure 1 : STOCK PRICE CHART

Image source: google images
DATA PREPROCESSING:
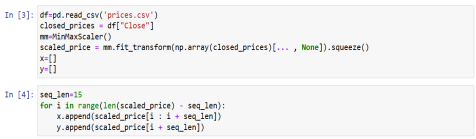
Data preprocessing is required to ensure the data accuracy, improve the model performance and avoid the biased or misleading results. In our case of stock price analysis we first select the required column from the data set like opening price or closing price of the stock. Then we also select a sequence length say ‘n’ based on this n previous day’s stock prices we will predict the stock price of the current. For this we also perform the minmax normalization of the data so as for easier analysis while training the model. Also do not forget to apply the inverse on the results while calculating the result.
Then we create x and y variables where x stores the previous n days observations and y stores the current day price of the particular stock, that x is known data and y is the data which should be predicted based on values from x.
It can be implemented as:
Figure 2: Data preprocessing of time series
SPLITTING THE DATA:
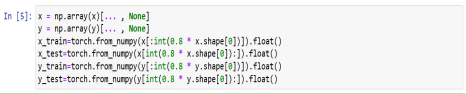
Then the next step is we want to split the data which is preprocessed into 2 parts. So that, we can use the larger one for training of the model and the other one for testing the model we built. The best thing we can do for this in time series analysis is we can use first 80% of the data for training and remaining 20% of the data for testing. This step can be implemented as:
Figure 3: Splitting the data
SELECTING OF THE MODEL:
Since the data is sequential we can use neural network. Since input size is variable and is equal to sequence length we can use a recurrent neural network. But the problem arising here are:
1. Taking large time for training the model
2. Very complex for larger sequences
3. Vanishing gradient problem
So LSTM is the model build by improving all these problems. LSTMs are capable of remembering information for long period of time. LSTM units include a ‘memory cell’ that can maintain information in memory for long periods of time. LSTMs also deals with vanishing gradient problem by introducing new gates, such as input and forget gates, which allow for a better control over the gradient flow and enable better preservation of long-range dependencies.
Figure 4: RNN vs. LSTM
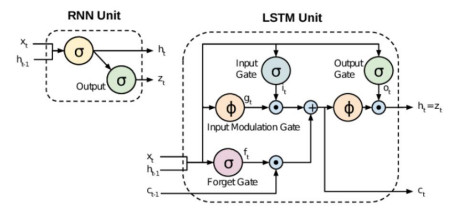
Src: Google images
CONSTRUCTING MODEL:
LSTM model can be build using of the torch module in python. Our LSTM model can be build by creating a class in which we call a constructor, with one lstm layer followed by fully connected layer.
Figure 5: LSTM Modelling in PyTorch
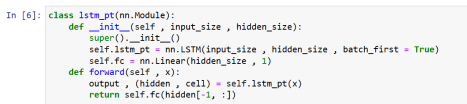
The output of the nn.LSTM is a tuple with two elements. The first element is hidden state and the second element is the LSTM’s cell memory and the hidden states. The output of this hidden state is further passed as an input to the fully connected (fc) layer so as to produce a single regression output.
TRAINING THE MODEL:
As our problem is a regression based problem, we choose Mean Square Error (MSE) as the loss function and it can be minimized by using of the Adam optimizer. Then by choosing hidden size, learning rate and number of epochs as the hyper parameters we have trained our model.
Figure 6: Training of the model
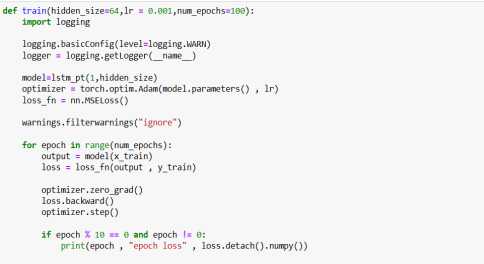
We have trained in a function so that we can easily train our model with different parameters so that it is easily to train our model just by calling the function using parameter tuning.
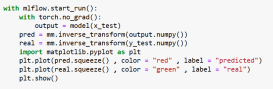
PREDICTING AND ANALYSIS OF THE MODEL:
We can predict the output for testing data and store the predicted values in a variable pred. Then we can apply the inverse of MinMax Normalization applied in the data preprocessing step so that we get actual predicted value. Then we can plot these values on a graph and we can visualize the actual and predicted stock prices.
Figure 7: Predicting and Plotting
For analyzing of a regression model, we can use metrics like r2 score, Root Mean Square Error (RMSE) and Mean Absolute Error (MAE) and using of these metrics, we can select the best model.
Figure 8: Metrics calculation

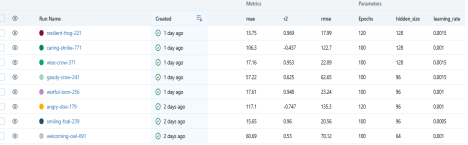
For better analysis of all the models we have also logged our model, parameters and metrics on the mlflow.
Figure 9: Logging on Mlflow

Figure 10: Analysis of various models on MLFlow UI
After performing of the hyper parameters tuning, the output of the best model is:

Figure 11: Predicted vs. Real values
CONCLUSION:
In this article, we learnt how to perform the analysis of a time series dataset with the help of stock price dataset. We have also built the LSTM model using of PyTorch module and performed analysis of models by hyper parameters tuning and done the analysis of the results on the MLFlow dashboard.
REFERENCES:
https://pytorch.org/tutorials/beginner/nlp/sequence_models_tutorial.html
https://machinelearningmastery.com/lstm-for-time-series-prediction-in-pytorch/
ALSO CHECK THEM OUT:
1. Want to check consequences due to untested AI/ML model. Visit this link.
2. To check about a testing company. Go through this link.
3. Curious about various job opportunities in data science. Refer to this link.
4. To read more awesome articles. Check this link.
By Manchi Sai Chandra
Shiva kumar