SHAP Feature Importance in Structured Classification

Recently the European Union (EU) through the High-Level Expert Group on Artificial Intelligence (AI-HLEG) and the General Data Protection Regulation (GDPR) has recently posed an interesting challenge to the AI community, by demanding a more user-centered approach to explaining Automated Decision-Making systems (ADMs) using explainable AI(XAI)
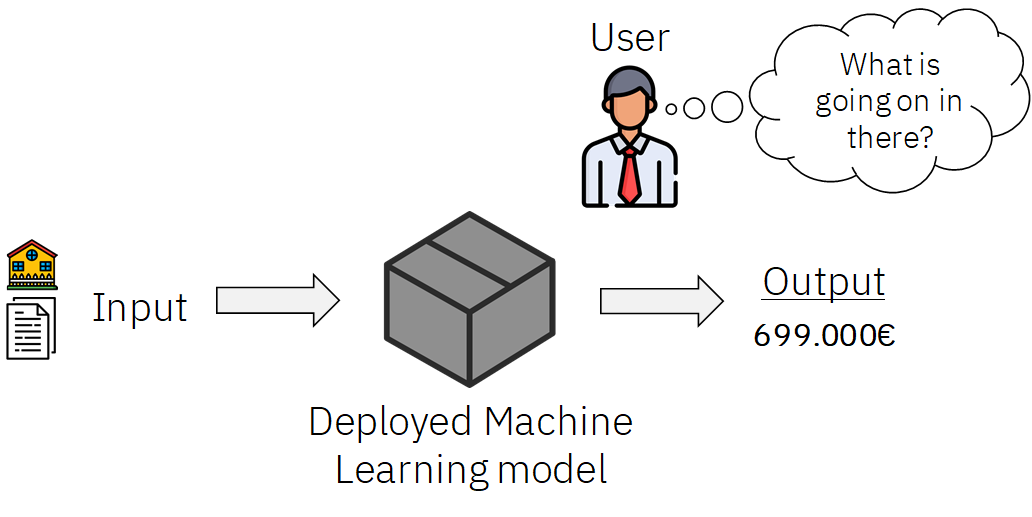
XAI is a most important part of any machine learning pipeline it is used to make decisions more interpretable and trustworthy. This guide provides a practical example of how to use and interpret the open-source python package, SHAP, for XAI analysis in Structured data classification.
What is SHAP?
SHAP (Shapley Additive Explanations) by Lundberg and Lee (2016) is an approach based on a game theory to explain the output of machine learning models. It provides a means to estimate and demonstrate how each feature’s contribution influences the model. SHAP values are calculated for each feature, for each value present, and approximate the contribution towards the output given by that data point. It’s worth noting, that the same values of a feature can contribute different amounts towards an output, depending on the other feature values for that row.
SHAP provides global feature contribution interpretation methods based on aggregations of Shapley values. In this article we will use the Mushroom Data Set as an example we will try to classify whether a mushroom is edible or poisonous based on input features.
Let's get started with importing Libraries
Read dataset
import pandas as pd
import numpy as np
import matplotlib.pyplot as plt
from sklearn.model_selection import train_test_split
from sklearn.ensemble import RandomForestClassifier
from sklearn.preprocessing import LabelEncoder
from sklearn.metrics import confusion_matrix,classification_report,accuracy_score
mushrooms = pd.read_csv('/content/mushrooms.csv')
mushrooms

Preprocessing:
Here we try to convert all categorical variables to numeric using Label Encoder
#taking care of categorical values
le=LabelEncoder()
for i in mushrooms.columns:
    mushrooms[i]=le.fit_transform(mushrooms[i])
Splitting data into train and test data
#defining dependent and independent variables
x = mushrooms.drop('class', axis=1)
y = mushrooms['class']
#splitting data into training and testing set
x_train, x_test, y_train, y_test = train_test_split(x, y, test_size = 0.3, random_state = 0)
Build Random Forest Classifier and check the classification report for Precision-Recall and F1-score
#Random Forest
#training model
rf = RandomForestClassifier()
rf.fit(x_train,y_train)

#getting confusion matrix
y_pred = rf.predict(x_test)
cm = confusion_matrix(y_test,y_pred)
print('confusion matrix:\n',cm)

#checking accuracy
rfa = accuracy_score(y_test,y_pred)
print('accuracy score = ',accuracy_score(y_test,y_pred))
print("Classification Report",classification_report(y_test,y_pred))

Next Step we will install Shap using Command
!pip install shap
Since we are using a random forest model we will use Tree Explainer for the Feature Importance plot for a Kernel-based model we use Kernel Explainer
class_name = ['Edible','Poisonous']
plt.style.use('dark_background')
shap_values = shap.TreeExplainer(rf).shap_values(x_test, check_additivity = False)
shap.summary_plot(shap_values,x_test,class_names= class_name,show = True)

The summary plot combines feature importance with feature effects. Each point on the summary plot is a Shapley value for a feature and an instance. The position on the y-axis is determined by the feature and on the x-axis by the Shapley value. For each feature, we plot feature importance in descending order and we can check the color bar for determining a particular class.
Summary:
These plots tell us which features are the most important for a model and hence, we can make our machine learning models more interpretable and explanatory.
References:
2. https://christophm.github.io/interpretable-ml-book/shapley.html
3. https://github.com/slundberg/shap
Do Checkout :
One such product which can do end to end testing which involves Bias , Explainability , Adversarial Attacks , Performance Testing , Data Generation is AIEnsured by TestAIng.
 Bhavana Chunchu