The Importance of PDP in Regression Problems

Model interpretability is becoming a progressively appreciated aspect. Though, when handling large models with complex relationships, interpretation is always a tedious task but is a very important part. PDP is a part of Interpretability which can be put on Supervised and Unsupervised Learning problems.
Partial dependence plots show how each variable or predictor affects the model's predictions. This is useful for questions like:
- How much are wage differences between men and women, solely due to gender, as opposed to differences in educational backgrounds or work experience?
- Controlling house characteristics like what impact do longitude and latitude have on home prices? To restate this, we want to understand how similarly sized houses would be priced in different areas, even if the homes actually at these sites are different sizes.
- What are health differences between two groups due to differences in their diets, or due to other factors? How does age affect the cardiovascular system?what age is heart disease most common?
What is PDP
When the predictive task is a regression model, the changes shown in the output are directly the change in prediction. However, during classification, the output change is the change in the predicted probability of the class.
PDP-based Feature Importance
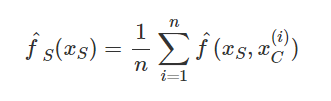
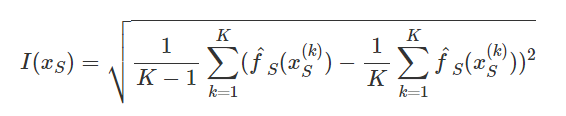
The basic motivation is that a flat PDP indicates that the feature is not important, and the more the PDP varies, the more important the feature is. For numerical features, importance is defined as the deviation of each unique feature value from the average curve:
This PDP-based feature importance should be interpreted with care. It captures only the main effect of the feature and ignores possible feature interactions. A feature could be very important based on other methods such as permutation feature importance, but the PDP could be flat as the feature affects the prediction mainly through interactions with other features. Another drawback of this measure is that it is defined over the unique values. A unique feature value with just one instance is given the same weight in the importance of computation as a value with many instances.
Enough Theory ! Let's Do Hands on
Partial dependence shows how a particular feature affects a prediction. By making all other features constant, we want to find out how the feature in question influences our outcome. Partial dependence allows us to generalize this interpretation to models more sophisticated and complex than simple linear regression.
pip install pdpbox
Importing the necessary Libraries
# Import libraries
import matplotlib.pyplot as plt
import pdpbox.pdp as pdp
from sklearn.tree import DecisionTreeClassifier
from sklearn.model_selection import train_test_split
from sklearn import tree
import pandas as pd
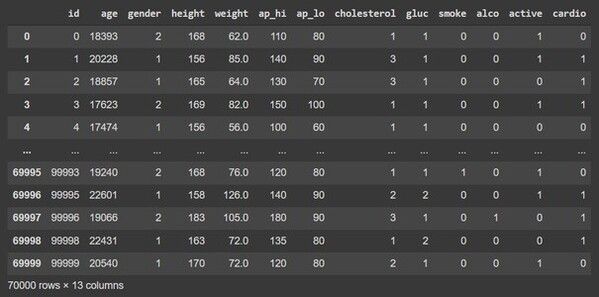
df = pd.read_csv("/content/cardio_train.csv")
df
Model Building
# Split the data into train and test sets

features = df.drop('cardio', axis=1)
target = df['cardio']
X_train, X_test, y_train, y_test = train_test_split(features, target)

# Fit a decision tree
clf = DecisionTreeClassifier(random_state=42, max_depth=3)
clf.fit(X_train, y_train)
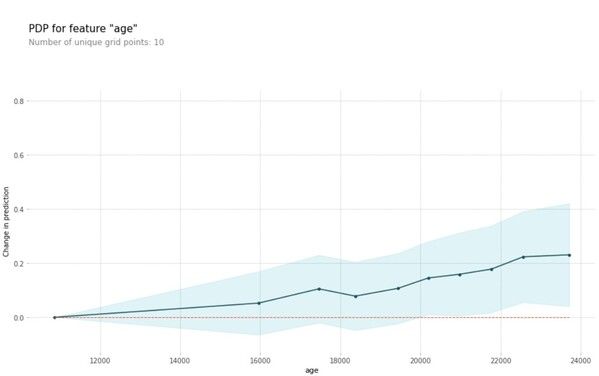
Partial Dependency Plot for Age feature
graph = tree.export_graphviz(clf, feature_names=features.columns)
pdp_age = pdp.pdp_isolate(clf, X_test, features.columns, feature='age')
pdp.pdp_plot(pdp_age, 'age')
plt.ylabel("Change in prediction")
plt.show()
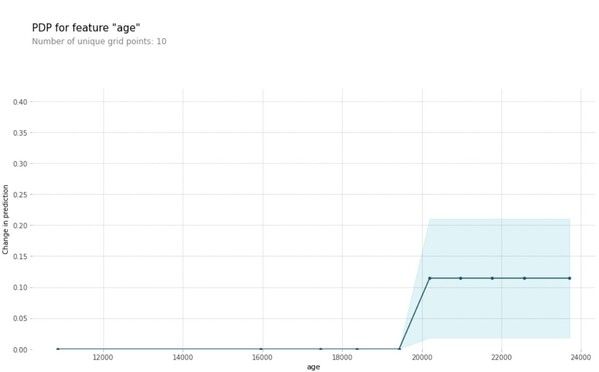
The plot above shows the partial dependence plot for the feature age. The target variable we are trying to predict is the presence of cardiovascular disease. We can see that as the age feature goes above 19000 days (around 52 years), it starts to affect the prediction in a positive way (a higher age translates to a higher probability of cardiovascular disease). When thinking about this insight intuitively, the model makes sense and we are more likely to trust its predictions.
The decision tree we are using is still relatively simple and its partial dependency plot may not paint the whole picture. Let’s try again, this time with a random forest model.
# Import libraries
from sklearn.ensemble import RandomForestClassifier

# Fit a random forest classifier
rf = RandomForestClassifier(random_state=42)
rf.fit(X_train, y_train)

# Create a partial dependency plot
pdp_clstrl = pdp.pdp_isolate(rf, X_test, features.columns, feature='age')
pdp.pdp_plot(pdp_clstrl, 'age')
plt.ylabel("Change in prediction")
plt.show()
Using a more complex model like random forest, we see that the age feature affects our predictions more linearly as opposed to the ‘step-like’ prediction effect we saw when we used a simpler decision tree.
Conclusion
Partial Dependency Plot is a great way to start understanding AI models. In addition, they are easy to implement and apply to every model. This plot is dependent on the underlying model used in the supervised learning task. However, they explain model behaviors overall and at the individual instance level. Thus, they allow you to interpret your models effectively.
References
- https://christophm.github.io/interpretable-ml-book/pdp.html
- https://www.kaggle.com/code/dansbecker/partial-dependence-plots/notebook
- Dataset - https://www.kaggle.com/datasets/sulianova/cardiovascular-disease-dataset
- https://towardsdatascience.com/explain-machine-learning-models-partial-dependence-ce6b9923034f
- https://towardsdatascience.com/how-to-interpret-models-pdp-and-ice-eabed0062e2c
Do check out:
-
If you want to refer Partial Dependency Plot on Classification Task, Please check this article - GHOST_URL/p/cee4f023-4b41-40b1-89ce-3dea3eb0c8e5/
-
Also, testAIng offers Explainability solutions like Data Augmentation generation, Fairness/bias evaluation, Explainability and interpretability, and much more. For a solution, you can refer to this - Link