Captum- model interpretability library for PyTorch

Interpretability in AI refers to the ability to explain how artificial intelligence models arrive at their predictions or decisions in a way that humans can easily comprehend. It allows us to understand the inner workings of AI models, make fair judgments, ensure their reliability, and hold them accountable.
What is Captum
Captum is a model interpretability library for PyTorch which currently offers a number of attribution algorithms that allow us to understand the importance of input features, and hidden neurons and layers. The word Captum means “comprehension” in Latin and serves as the linguistic root of the word “understanding” in many Latin-stemming languages.
Captum supports any PyTorch model, meaning it is not limited to classification models but can also be used for any application or domain. Some of the algorithms might be more common for certain types of applications, such as computer vision. Still, the implementations are generic so that the users can apply them to any PyTorch model, interpret, and visualize the attributions. For visualization, they also built an interactive tool called Captum Insights.
Which attribution algorithms are available in Captum?
The attribution algorithms are the backbone of Captum and help to formulate most of its processes. These attribution algorithms can be categorised into three parts –
- General Attribution: It helps evaluate the contribution of every input feature of the model to the output. It is calculated with the help of integrated gradients.
- Layer Attribution: These attribution algorithms help evaluate the contribution of every neuron in a specified layer to the model's output.
- Neuron Attribution: This specific algorithm helps evaluate every input feature's contribution to a specified secret neuron.
These are the three attribution algorithms that are available in Captum. These algorithms use Shapley values or SHAPs for interpretation of the models.
General Attribution Techniques
As of now, Captum includes eight algorithms that fall under the General Attribution category. These techniques can be used to evaluate the contribution of input features to the output of a model.
- Integrated Gradients: Represents the integral of gradients with respect to an input along the path of a baseline to the input.
- Gradient SHAP: Is a gradient method to compute SHAP values
- DeepLIFT: A back-propagation based approach to general importance attribution
- DeepLIFT SHAP: A extension of DeepLIFT to approximate SHAP values
- Saliency: Simple approach that returns the gradients of the output with respect to the input
- Input X Gradient: Extention of Saliency that takes the gradients of the output with respect to the input and then multiplies it by the input feature values.
- Guided Back-propagation: Computes the gradient of the target output with respect to the input, but back-propagation of ReLU functions is overridden so that only non-negative gradients are backpropagated. (Only available with the master branch, not with PIP yet)
- Guided GradCAM: computes the element-wise product of guided back-propagation attributions with upsampled (layer) GradCAM attributions (Only available with the master branch, not with PIP yet)
Layer Attribution techniques are great for learning how a particular layer affects the output. Currently, there are five-layer attribution techniques available in Captum:
- Layer Conductance: Combines the neuron activation with the partial derivatives of both the neuron with respect to the input and the output with respect to the neuron to give us a more complete picture of the importance of the neuron.
- Internal Influence: Approximates the integral of gradients with respect to a particular layer along the path from a baseline input to give input.
- Layer Activation: Layer Activation is a simple approach for computing layer attribution, returning the activation of each neuron in the identified layer.
- Layer Gradient X Activation: Like Input X Gradient but for hidden layers.
- GradCAM: Computes the gradients of the target output with respect to the given layer, averages for each output channel (dimension 2 of output), and multiplies the average gradient for each channel by the layer activations. Most often used for convolutional neural networks.
Neuron attribution methods help you to understand what a particular neuron is doing. They are great when combined with Layer Attribution methods because you can first inspect all the neurons in a layer, and if you don't understand what a particular neuron is doing, you can use a neuron attribution technique.
- Neuron Conductance: Like Layer Conductance but only for a single neuron.
- Neuron Gradient: Neuron gradient is the analog of the saliency method for a particular neuron in a network.
- Neuron Integrated Gradients: Neuron Integrated Gradients approximates the integral of input gradients with respect to a particular neuron along the path from a baseline input to the given input.
- Neuron Guided Backpropagation: Like Guided Backpropagation but for a single neuron.
How to make visualisation with the help of Captum?
By using all the parameters of the model, visualisation can be done in following ways –
- Heat mapping: A heat map is made by interpreting and representing the data as a coloured graphical model.
- Blended heat mapping: In this type of visualisation, the heat map is overlayed over the greyscale version of the image that was originally generated.
- Color Mapping: Assign specific colors to different data values. Red for negative, green for positive, and blue for absolute values.
- Graphical Plotting: Use tools like Matplotlib or NumPy to make various graphs.
- Masking: Show data as masked values by adjusting pixel values based on how much they cover.
- Alpha-Scaling: Set the transparency of each pixel based on its normalized value from masking.
- Mathematical Signs: Interpret data as a mix of positive and negative attributes, displaying pixel values for these attributes.
Image Visualisation Example
Here we are interpreting the Resnet model's prediction of images and comparing the resuts using attribution techniques such as 'Integrated Gradients' & 'Occlusion' provided by Captum.
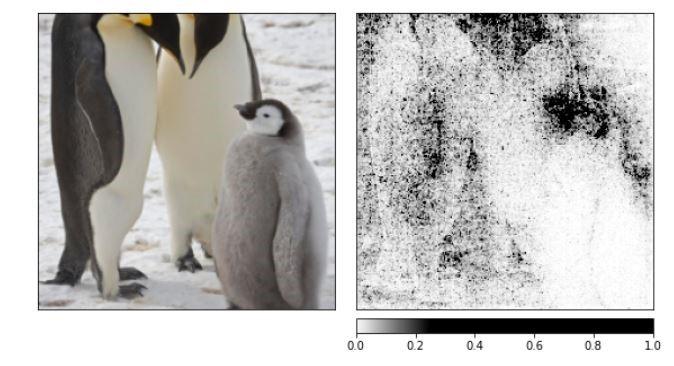
Scenario 1 - Correct Prediction by PyTorch model. Here the input image is penguin and the model prediction is "king penguin" as expected. Attribution Outputs Integrated Gradients
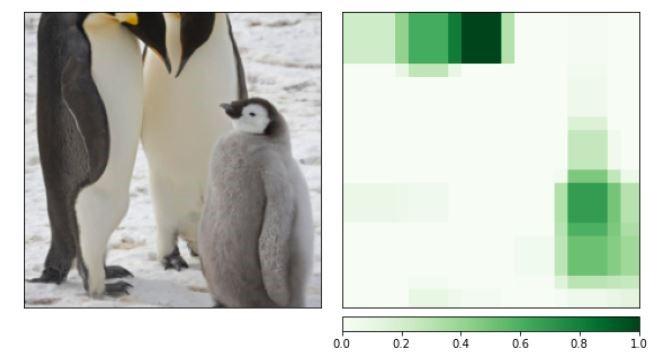
Occlusion Graph Large Window size
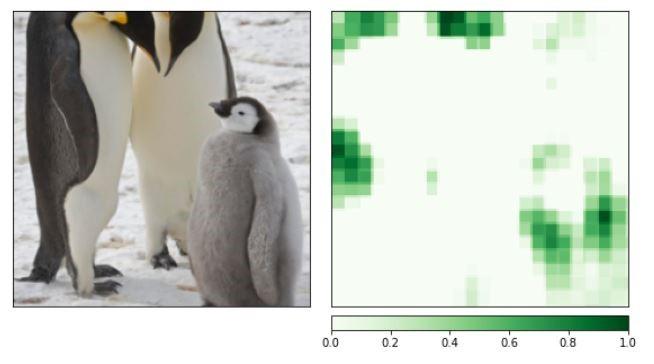
Occlusion Graph Small Window size
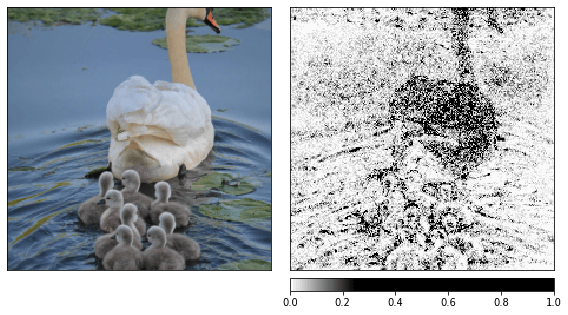
Scenario 2 - Incorrect Prediction by PyTorch model.
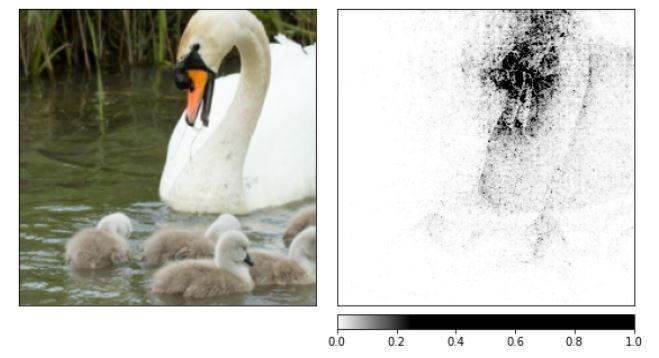
Here the input image is of swan but the model wrongly interprets it as penguin. In scenarios like this, captum's attribution graphs are very helpful to figure out why the model wrongly interpreted it and where was it actually looking at. Let us see the outputs of Integrated gradients graph and occlusion graphs to figure out why it identified swan as penguin.
Attribution Outputs Integrated Gradients
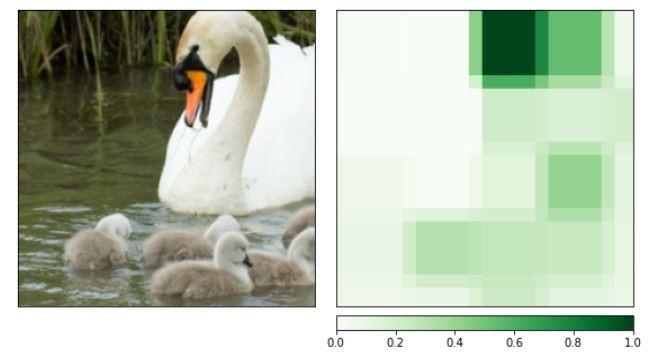
Occlusion Graph Large Window size
Occlusion Graph Small Window size
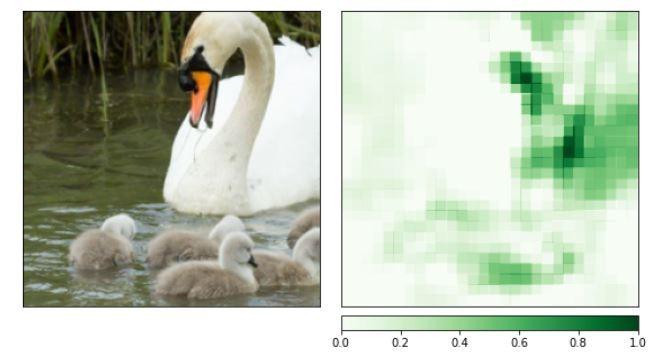
As we could clearly see from the graphs that the upper part of the goose, espectially the beak, seems to be the most critical for the model to predict this class. Since it highly resembles penguin's head shape and beak, the swan is wrongly interpreted as penguin.
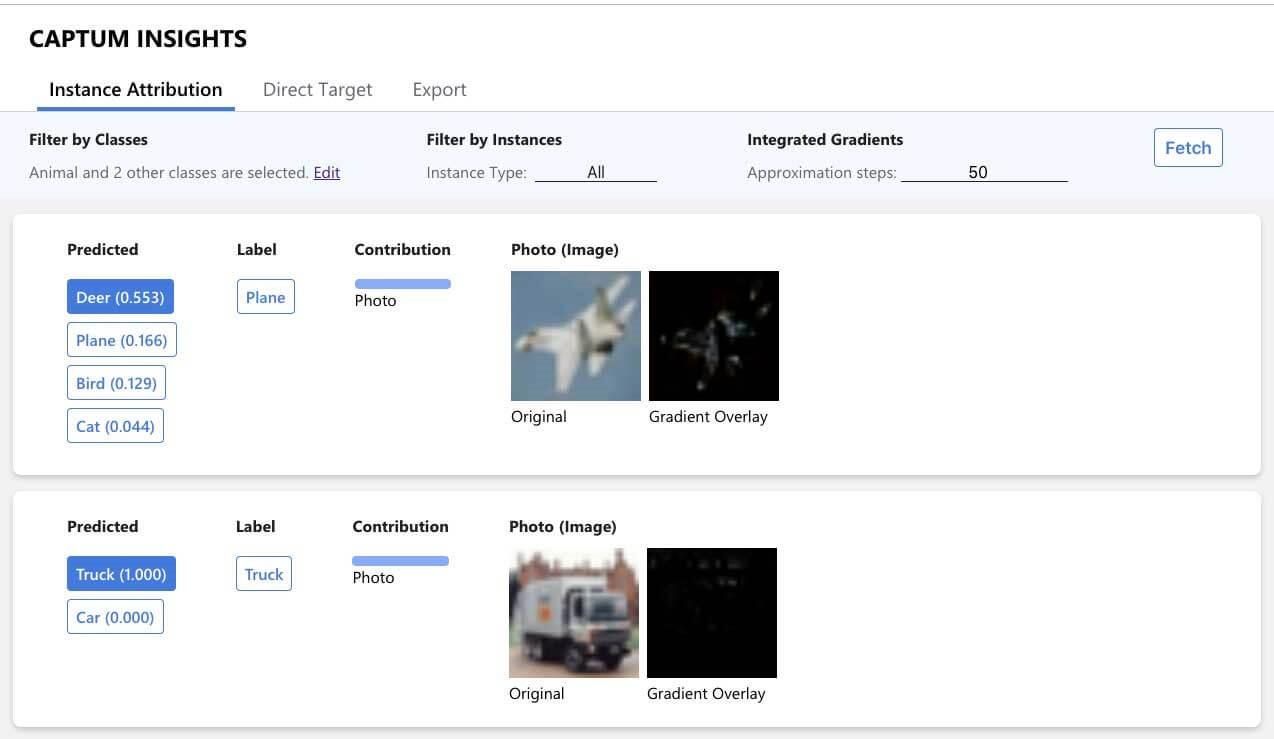
Captum Insights
Even with libraries like Captum, understanding models without proper visualization can still be challenging. Image and text input features can be challenging to understand without these visualizations.
That's why Captum also offers an interpretability visualization widget built on top of it called Captum Insights.
A Captum Insights example can be opened with the following command:
Captum Insights also has a Jupyter widget providing the same user interface as the standalone webpage. To install and enable the widget, run:
Captum Insights Example
To use Captum Insights, you need to create a data iterator and a baseline function. After creating these two, you need to create an AttributionVisualizer and pass it the model, classes, score function, data iterator, and the baseline function.
You can find a complete example of how to use Captum Insights on This Github.
Conclusion
As the need for interpretable AI models continues to grow, Captum stands out as a powerful and user-friendly library that equips researchers and practitioners with the necessary tools to unravel the decision-making process of PyTorch models. By enhancing transparency and interpretability, Captum fosters trust, accountability, and fairness in the field of AI. Its continued advancement remains vital in bridging the gap between AI models and the interpretability required in critical domains.
References
- https://github.com/pytorch/captum
- https://blog.paperspace.com/model-interpretability-and-understanding-for-pytorch-using-captum/
- https://www.e2enetworks.com/blog/introduction-to-captum-a-model-interpretability-library-for-pytorch
- https://medium.com/pytorch/introduction-to-captum-a-model-interpretability-library-for-pytorch-d236592d8afa
Written by - Ankit Mandal