LIME For Regression Problems

LIME stands for Local Interpretable Model Agnostic Explanations. Lime is one of the techniques of visualization that helps to explain individual predictions with model interpretability. Now, let's look what LIME means..
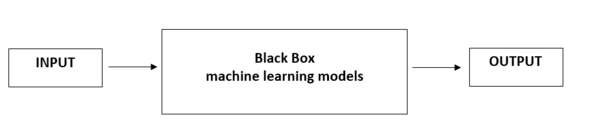
Local surrogate models are interpretable models used to explain individual predictions of black box models in machine learning. LIME focuses on training local surrogate models.
The term model-agnostic means it can be applied on any machine learning models. To know more about model-agnostic, here is the The LIME technique is to understand the perturbing data samples and understand the changes in the prediction.
Understanding LIME algorithm
LIME explains the prediction of desired input by sampling its neighboring inputs and learning a sparse linear model based on the predictions of these neighbors, features with large coefficients in linear model are then considered to be important for that input's prediction.
Specifically, generating a local explanation for an input requires sampling around the input to generate an explanation for its prediction.
Let's do some hands on with Python.
Before you get started, we need to install lime
!pip install lime
Next, import all the required libraries
import numpy as np
import pandas as pd

from sklearn.model_selection import train_test_split
from sklearn.ensemble import RandomForestRegressor
from sklearn.metrics import mean_squared_error, r2_score
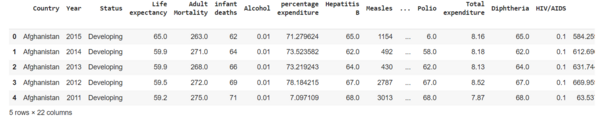
Load the dataset
data_path = '/content/Life Expectancy Data.csv'
data = pd.read_csv(data_path)
print(data.head())
Let's look if there are null values in the data. There are lot of missing values in the dataset. For convenience, fill them by the mean of respective columns.
data.isnull().sum()
data = data.fillna(data.mean())
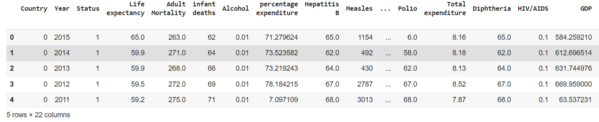
Now, let's convert categorical to numerical by using Label Encoding
# Import label encoder
from sklearn import preprocessing

# label_encoder object knows how to understand word labels.
label_encoder = preprocessing.LabelEncoder()

# Encode labels in columns 'Country, Status'.
data['Country']= label_encoder.fit_transform(data['Country'])
data['Status']= label_encoder.fit_transform(data['Status'])
data.head()
Split the data into train and test data and dividing the data dependent and independent features
train, test = train_test_split(data, test_size=0.2)
train_x = train.loc[:, train.columns != "Life expectancy "]
test_x = test.loc[:, test.columns != "Life expectancy "]
train_y = train["Life expectancy "]
test_y = test["Life expectancy "]
Now, build the model with Random Forest Regressor
model = RandomForestRegressor(max_depth=6, random_state=0, n_estimators=10)
model.fit(train_x, train_y)
prediction of the model
test_pred = model.predict(test_x)
print(mean_squared_error(test_y, test_pred))
print(r2_score(test_y, test_pred)*100)
Interpret model predictions with LIME. We need to import lime package
import lime
import lime.lime_tabular
Create the explainer. Lime has one explainer for all the models
explainer = lime.lime_tabular.LimeTabularExplainer(train_x.values, feature_names=train_x.columns.values.tolist(),verbose=True, mode='regression')
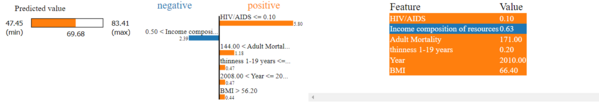
Here, I will choose 2 instances and use them to explain the predictions
Select 5th instance
# Choose the 5th instance and use it to predict the results
j = 5
exp = explainer.explain_instance(test_x.values[j], model.predict, num_features=6)
# Show the predictions
exp.show_in_notebook(show_table=True)
Select 10th instance
# Choose the 10th instance and use it to predict the results
j = 10
exp = explainer.explain_instance(test_x.values[j], model.predict, num_features=6)
# Show the predictions
exp.show_in_notebook(show_table=True)
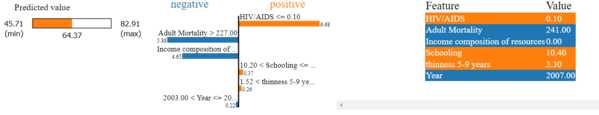
LIME creates local surrogate model around the observation to be explained and uses co-efficient of this model to identify the most influencing features due to which particular prediction has been made.
In the 5th instance we can see the features affecting the prediction positively and negatively. Likewise, for the 10th instance the features are different compared to the 5th instance. This shows that for each instance the features affecting the prediction are different.
References
- https://towardsdatascience.com/unboxing-the-black-box-using-lime-5c9756366faf
- https://www.kaggle.com/code/prashant111/explain-your-model-predictions-with-lime/notebook
- https://www.kaggle.com/datasets/kumarajarshi/life-expectancy-who
Check this to know more
If you want to know more about Text and Image
AIensured provides solution for Explainability, Metamorphic Testing and Counterfactuals. To check out these functionalities and to know more refer to Link