SHAP Instance Level Importance for Text Classification
SHAP stands for SHapley Additive exPlanations. It uses Shapley values as its core to explain individual predictions. Shapley values come from Game Theory where each feature present in the data is the player in the game and the final reward is the prediction that is made.

SHAP Local
SHAP stands for SHapley Additive exPlanations. It uses Shapley values as its core to explain individual predictions. Now, what are Shapley values? Let's get to that immediately. Shapley values come from Game Theory where each feature present in the data is the player in the game and the final reward is the prediction made. Based on the reward, Shapley values help to distribute this reward fairly among players. SHAP is an explainable AI(XAI) technique that can be used both for global and local explanations. To know more about the importance of explainability in AI. Check this link. Here, the focus will be on local explanations. What is LOCAL anyways? It is used to explain individual predictions.
Why is there a need for it?
Machine Learning is a field that has grown tremendously in the past decade. Now, more and more organizations want to reap the benefits of it. To do so, they need to integrate machine learning techniques into their existing systems. Machine Learning can be used to automate large numbers of tasks present in traditional systems. But while the benefits presented by adopting machine learning are immeasurable, there is a need to understand how these machine learning models make decisions. People tend to assume that since machine learning models are based on mathematical algorithms, they are free from any kind of bias. But, they couldn't be more wrong, in case the data used for training the machine learning model is biased in any way then the model predictions become biased automatically. To explain the decisions made by these machine learning models, there comes a need for explainability techniques like SHAP.
Without wasting any time let's get to the implementation part
Importing all the required libraries
# importing libraries
import pandas as pd
import matplotlib.pyplot as plt
import string
import re
import nltk
import numpy as np
from nltk.corpus import stopwords
from nltk.tokenize import RegexpTokenizer
from sklearn.model_selection import train_test_split
from sklearn.feature_extraction.text import TfidfVectorizer
from sklearn.linear_model import LogisticRegression
from sklearn import metrics

# downloading the nltk data for preprocessing
nltk.download('stopwords')
nltk.download('punkt')
Now, loading the csv files using the read_csv() function from pandas library.
train = pd.read_csv("/content/drive/MyDrive/SHAP/train.csv")
test = pd.read_csv("/content/drive/MyDrive/SHAP/test.csv")
Next comes the preprocessing step. This includes removing hashtags, punctuations, converting the text to lower case, etc.
# NLP pre-processing
# remove urls, handles, and the hashtag from hashtags

def remove_urls(text):
  new_text = ' '.join(re.sub("(@[A-Za-z0-9]+)|([^0-9A-Za-z \t])|(\w+:\/\/\S+)"," ",text).split())
  return new_text

# make all text lowercase
def text_lowercase(text):
  return text.lower()

# remove numbers
def remove_numbers(text):
  result = re.sub(r'\d+', '', text)
  return result

# remove punctuation
def remove_punctuation(text):
  translator = str.maketrans('', '', string.punctuation)
  return text.translate(translator)

# function for all pre-processing steps
def preprocessing(text):
  text = text_lowercase(text)
  text = remove_urls(text)
  text = remove_numbers(text)
  text = remove_punctuation(text)
  return text

# pre-processing the text body column
pp_text = []
for text_data in train['text']:
  # check if string
  if isinstance(text_data, str):
    pp_text_data = preprocessing(text_data)
    pp_text.append(pp_text_data)
   # if not string
  else:
    pp_text.append(np.NaN)

# add pre-processed column to dataset
train['pp_text'] = pp_text
Followed by splitting the data into training and test set. Vectorizing with the help of TF-IDF vectorizer.
# split the data into training and testing sets
X_train, X_test, y_train, y_test = train_test_split(train["pp_text"], train["target"])

# create bag-of-words with weights using tfid vectoriser
# strip accents and remove stop words during vectorisation
tf=TfidfVectorizer(strip_accents = 'ascii', stop_words='english')

# transform and fit the training set with vectoriser
X_train_tf = tf.fit_transform(X_train)
# transform the test set with vectoriser
X_test_tf = tf.transform(X_test)
Creating and training the logistic regression model.
# create logistic regression model
logreg = LogisticRegression(verbose=1, random_state=0, penalty='l2', solver='newton-cg')
# train model on  vectorised training data
model = logreg.fit(X_train_tf, y_train)
Download the SHAP library using the following command
!pip install shap
KernelExplainer is model-agnostic(independent of the model's internal structure), but it is a time-consuming algorithm. So, it is required to create small samples. To know more about model-agnostic, refer to this link.
# importing SHAP
import shap

# sampling data from the training and test set to reduce time-taken
X_train_sample = shap.sample(X_train_tf, 200)
X_test_sample = shap.sample(X_test_tf, 40)

# creating the KernelExplainer using the logistic regression model and training sample
SHAP_explainer = shap.KernelExplainer(model.predict, X_train_sample)
# calculating the shap values of the test sample using the explainer
shap_vals = SHAP_explainer.shap_values(X_test_sample)

# converting the test samples to a dataframe
# this is necessary for non-tabular data in order for the visualisations
# to include feature value
colour_test = pd.DataFrame(X_test_sample.todense())
Using the SHAP library on a single Tweet prediction.
shap.initjs()
shap.force_plot(SHAP_explainer.expected_value, shap_vals[1,:], colour_test.iloc[1,:], feature_names=tf.get_feature_names())
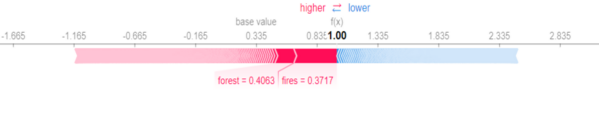
Here, the Tweet prediction value is 1, which means it is a disaster. Now, let's try to understand the output. Features with red color push the prediction probability higher while those in blue push the probability lower. The plot clearly shows that words such as fires contributed to the prediction being a disaster tweet.
Let's apply it on another prediction.
shap.initjs()
shap.force_plot(SHAP_explainer.expected_value, shap_vals[2,:], colour_test.iloc[2,:], feature_names=tf.get_feature_names())
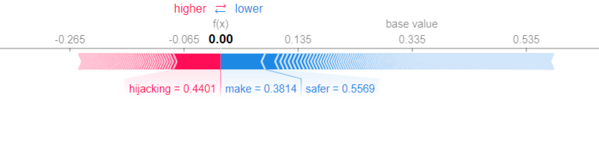
In this case, the Tweet prediction value is 0, which means it is not a disaster. Words such as safer contributed to the prediction being a disaster tweet.
Conclusion
In this article, the SHAP technique is applied to Kaggle's Disaster Tweet dataset. The words that influenced the prediction can be seen clearly on implementing the technique. This helps us understand the model's prediction. It brings out transparency to the working of complex machine learning models.
References:
- https://arxiv.org/abs/2106.14648
- https://christophm.github.io/interpretable-ml-book/shap.html
- https://github.com/KaliaBarkai/KaggleDisasterTweets
- Dataset link.
Also Checkout:
- For information on SHAP features an importance in text data. Refer to this link.
- If interested in SHAP features in audio data. Check out this link.
- Want to know how it works for structured data. Do check this link.
- One such magical product that offers explainability is AIEnsured by testAIng. Do check this link.